

 Financials
CONDENSED INTERIM FINANCIAL STATEMENTS FOR THE SECOND HALF YEAR AND FULL YEAR ENDED 31 MARCH 2026
Financials Archive![]() Note: Files are in Adobe (PDF) format.
Note: Files are in Adobe (PDF) format.
Please download the free Adobe Acrobat Reader to view these documents.
Condensed interim financial statements For the second half year and full year ended 31 March 2026
Condensed interim consolidated statement of profit or loss and other comprehensive income for the second half year and full year ended 31 March 2026
Condensed interim statements of financial position as at 31 March 2026
Review of Income Statement of the Group
Second Half FY2026 ("2H FY2026") vs Second Half FY2025 ("2H FY2025")
Revenue
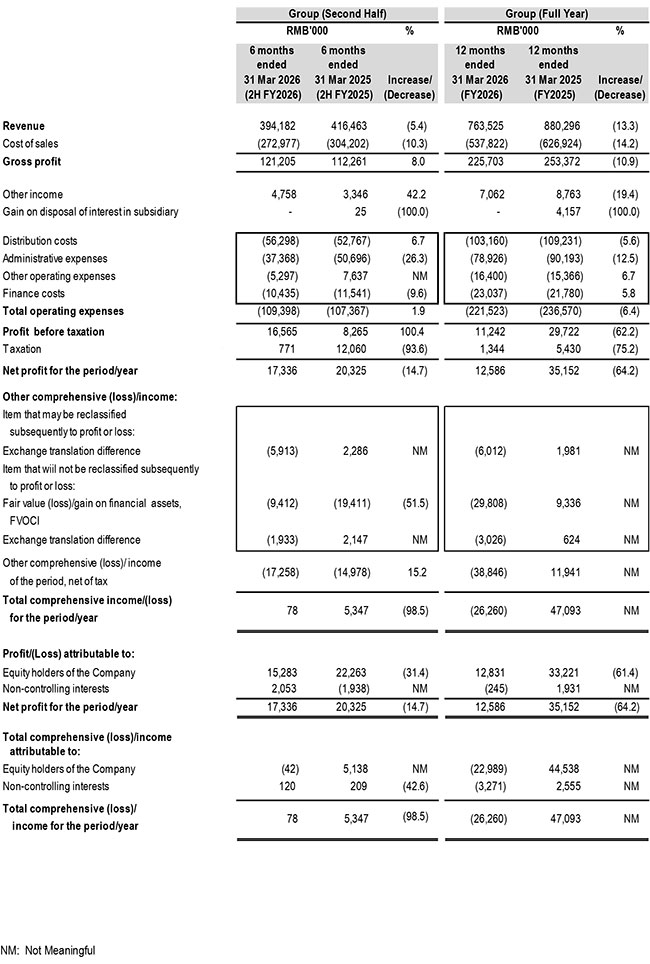
Group revenue decreased by 5.4% to RMB394.2 million in 2H FY2026 as compared to RMB416.5 million in 2H FY2025.
The decrease is attributed to lower revenue from the sale of manufactured tower cranes and components, which dropped by RMB25.1 million from RMB281.7 million in 2H FY2025 to RMB256.7 million in 2H FY2026. This was slightly offset by an increase in rental and service income, which rose by RMB2.8 million to RMB137.5 million in 2H FY2026 from RMB134.7 million in 2H FY2025.
Geographically, revenue in the PRC declined by RMB80.7 million, dropping to RMB145.6 million in 2H FY2026 from RMB226.3 million in 2H FY2025. However, this decline was partially offset by growth in international markets:
- Asia (outside the PRC): Increased by RMB21.4 million to RMB148.5 million in 2H FY2026 from RMB127.1 million in 2H FY2025.
- USA & Europe: Increased by RMB24.8 million to RMB37.9 million in 2H FY2026 compared to RMB13.0 million in 2H FY2025.
- Middle East & others: Rose by RMB12.1 million to RMB62.2 million in 2H FY2026 from RMB50.1 million in 2H FY2025.
Overall, sales in Asia (outside the PRC) was the largest contributor at 37.7% of Group revenue in 2H FY2026, followed closely by The PRC at 36.9%, Middle East & others at 15.8%, and the USA & Europe at 9.6%.
Gross profit and gross profit margin
Despite the decline in revenue, gross profit increased by 8.0% to RMB121.2 million in 2H FY2026 from RMB112.3 million in 2H FY2025 and gross profit margin also improved to 30.7% in 2H FY2026 from 27.0% in 2H FY2025. This was primarily driven by a favorable sales mix shift, specifically the increased sales volume of our higher-margin luffing model.
Other income
Other income increased by RMB1.4 million to RMB4.8 million in 2H FY2026 as compared to RMB3.3 million in 2H FY2025. The increase is mainly due to higher government grants received and interest income from sales with installment payments, partially offset by lower gains on the disposal of PPE and lower scrap material sales.
Operating income/expenses
Total operating expenses remained relatively flat, increasing slightly by 1.9% to RMB109.4 million in 2H FY2026 as compared to RMB107.4 million in 2H FY2025.
Distribution costs rose by 6.7% to RMB56.3 million in 2H FY2026, compared to RMB52.8 million in 2H FY2025 primarily due to higher freight cost.
Administrative expenses decreased significantly by 26.3% to RMB37.4 million in 2H FY2026 as compared to RMB50.7 million in 2H FY2025. The decrease is mainly due to lower employee cost and professional fee.
Other operating expenses reported a net expense balance of RMB5.3 million in 2H FY2026 as compared to a net credit/income balance of RMB7.6 million in 2H FY2025. The differences was due to:
- The Group recorded a net exchange loss of RMB7.2 million in 2H FY2026 compared to a net exchange gain of RMB10.1 million in 2H FY2025; partially offset by
- A net reversal of provision for doubtful debts of RMB3.7 million in 2H FY2026, compared to a provision of RMB0.6 million in 2H FY2025.
The net exchange loss for 2H FY2026 arose mainly from the weakening of Hong Kong Dollars ("HKD") against Renminbi ("RMB") due to net RMB liabilities in the Hong Kong subsidiary's books, and the weakening of USD against RMB and SGD due to net USD assets in the PRC's and Singapore's subsidiary books.
Finance costs
Finance costs decreased by 9.6% to RMB10.4 million in 2H FY2026 as compared to RMB11.5 million in 2H FY2025, primarily due to lower interest rate during the period.
Taxation
The Group recorded a tax credit of RMB0.8 million in 2H FY2026, compared to a net tax credit of RMB12.1 million in 2H FY2025. The tax credit is primarily due to the utilisation of deferred tax assets from tax losses that were previously unrecognised.
Other comprehensive (loss)/income
The Group reported an other comprehensive loss of RMB17.3 million in 2H FY2026 as compared to RMB15.0 million in 2H FY2025.
Other comprehensive loss for 2H FY2026 primarily reflects:
- A fair value loss on financial assets, FVOCI of RMB9.4 million.
- A net exchange translation loss of RMB7.8 million arising from the translation of the net assets of our Hong Kong and Singapore subsidiaries.
Profit before taxation and net profit attributable to equity holders
As a result of the above, the Group recorded a profit before taxation of RMB16.6 million in 2H FY2026.
Net profit attributable to equity holders of the Company amounts to RMB15.3 million in 2H FY2026 decreased from RMB22.3 million in 2H FY2025.
Full Year FY2026 ("FY2026") vs Full Year FY2025 ("FY2025")
Revenue
Group revenue for Full Year FY2026 ("FY2026") decreased by 13.3% to RMB763.5 million, down from RMB880.3 million in FY2025. This decrease was largely from lower sales of tower cranes and components, which fell by RMB120.2 million to a total of RMB490.2 million from RMB610.4 million in FY2025. Rental and service income increased by RMB1.3 million to RMB273.3 million in FY2026 from RMB269.9 million in FY2025.
Geographically, revenue from all our market regions decreased in FY2026 as compared to FY2025:
- The PRC: Decreased by RMB35.2 million to RMB347.6 million in FY2026 from RMB382.8 million in FY2025.
- Asia (outside the PRC): Decreased by RMB43.4 million to RMB279.4 million in FY2026 from RMB322.9 million in FY2025.
- Middle East & others: Decreased by RMB28.2 million to RMB94.1 million in FY2026 from RMB122.3 million in FY2025.
- USA & Europe: Decreased by RMB10.0 million to RMB42.3 million in FY2026 from RMB52.3 million in FY2025.
Overall, sales in The PRC and Asia (outside the PRC) remained the largest contributors, accounting for 45.5% (FY2025: 43.5%) and 36.6% (FY2025: 36.7%) respectively of the Group revenue in FY2026.
Gross profit and gross profit margin
In line with the reduction in revenue, gross profit decreased by 10.9% to RMB225.7 million in FY2026, compared to RMB253.4 million in FY2025.
Despite the lower absolute profit, the gross profit margin increased to 29.6% in FY2026 from 28.8% in FY2025. This was primarily driven by a favorable sales mix shift, specifically the increased sales volume of our higher-margin luffing model and higher proportion of rental and service income.
Other income
Other income decreased by RMB1.7 million to RMB7.1 million in FY2026 as compared to RMB8.8 million in FY2025. The decrease is mainly due to lower rental income from sub-leasing of yard.
Operating expenses
Total operating expenses decreased by 6.4% to RMB221.5 million in FY2026 as compared to RMB236.6 million in FY2025.
Distribution cost decreased by 5.6% to RMB103.2 million in FY2026 as compared to RMB109.2 million in FY2025, primarily moving in tandem with lower overall sales volumes.
Administrative expenses decreased to RMB78.9 million in FY2026 as compared to RMB90.2 million in FY2025. The decrease is mainly due to lower employee cost and professional fee.
Other operating expenses increased by 6.7% to RMB16.4 million in FY2026, up from RMB15.4 million in FY2025. The differences was due to:
- The Group recorded a net exchange loss of RMB11.9 million in FY2026 compared to a net exchange gain of RMB4.3 million in FY2025; offset by
- Lower provision of expected credit loss of RMB1.6 million in FY2026 as compared to RMB9.8 million provision in FY2025; and
- Non-recurring debt written off of RMB5.5 million in FY2025 owing from Yongmao Machinery (Cambodia) Co., Ltd ("YMC"), subsequent to the full disposal of the Group's interest;
The exchange variance for FY2026 arose mainly from the weakening of Hong Kong Dollars ("HKD") against Renminbi ("RMB") due to net RMB liabilities in the Hong Kong subsidiary's books, and the weakening of USD against RMB and SGD due to net USD assets in the PRC's and Singapore's subsidiary books.
Finance costs increased by 5.8% to RMB23.0 million in FY2026 as compared to RMB21.8 million in FY2025, due to higher interest on leased assets. Interest on leased assets increased from RMB2.9m in FY2025 to RMB4.1 million in FY2026.
Taxation
The Group recorded a tax credit of RMB1.3 million in FY2026, compared to a net tax credit of RMB5.4 million in FY2025. The tax credit is primarily due to the utilisation of deferred tax assets from tax losses that were previously unrecognized.
Other comprehensive income/(expenses)
The Group reported other comprehensive loss of RMB38.9 million in FY2026 as compared to other comprehensive income of RMB11.9 million in FY2025.
The movement into other comprehensive loss pertains to:
- A fair value loss of RMB29.8 million from financial assets, FVOCI.
- A net exchange translation loss of RMB9.0 million arising from the translation of the net assets of our Hong Kong and Singapore subsidiaries.
Profit before taxation and net profit attributable to equity holders
As a result of the above, the Group recorded a profit before taxation of RMB11.2 million in FY2026.
Net profit attributable to equity holders of the Company amounts to RMB12.8 million in FY2026, down 61.4% from RMB33.2 million in FY2025.
Review of Financial Position of the Group
Non-current Assets
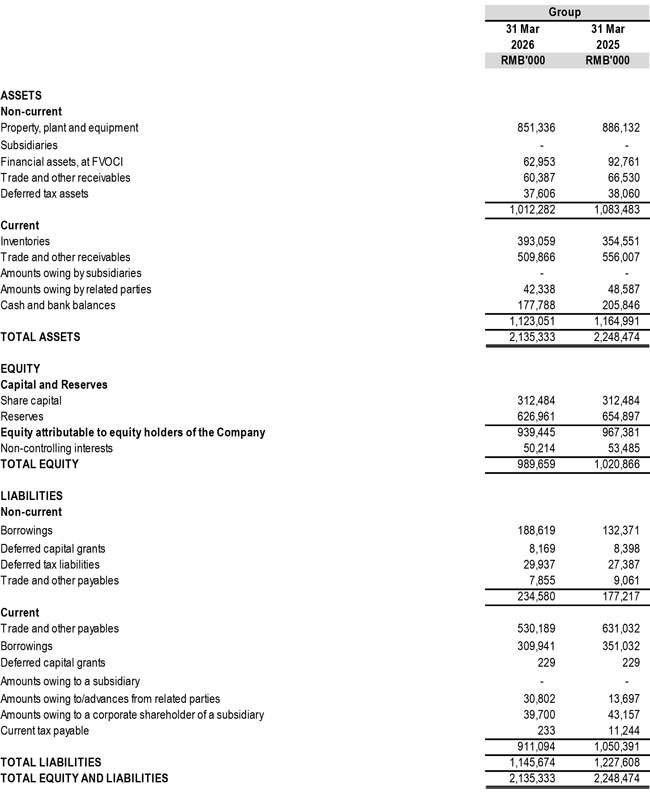
Non-current assets decreased by RMB71.2 million to RMB1,012.3 million as at 31 March 2026 from RMB1,083.5 million as at 31 March 2025. The decrease is mainly due to lower financial assets at FVOCI, lower property, plant and equipment, and lower trade and other receivables.
The Group's net carrying amount of property, plant, and equipment decreased by RMB34.8 million, driven primarily by depreciation, partially offset by net additions of rental fleets and capital expenditures on the new Hong Kong yard during the year.
Financial assets at FVOCI decreased due to a fair value loss of RMB29.8 million during the financial year.
Deferred tax assets decreased slightly by RMB0.5 million to RMB37.6 million as at 31 March 2026. Deferred tax assets arose mainly from provisions and elimination of unrealised profits in intragroup sales and the various provisions made.
Current Assets
Current assets decreased by RMB42.0 million to RMB1,123.1 million as at 31 March 2026 from RMB1,165.0 million as at 31 March 2025. The decrease is mainly due to lower trade and other receivables, lower cash and bank balances, and lower amounts owing by related parties, partially offset by higher inventories.
Inventories increased by RMB38.5 million to RMB393.1 million as at 31 March 2026 to support upcoming order deliveries.
Current trade and other receivables decreased by RMB46.1 million to RMB509.9 million as at 31 March 2026, which is in line with the lower Group revenue recorded during the year.
Non-current Liabilities
Non-current liabilities increased by RMB57.4 million to RMB234.6 million as at 31 March 2026 from RMB177.2 million as at 31 March 2025. The increase is mainly due to higher non-current borrowings of RMB56.2 million and higher deferred tax liabilities of RMB2.6 million, partially offset by a reduction in non-current trade and other payables.
Deferred tax provision was mainly made for withholding tax levied on dividends of undistributed earnings of PRC subsidiaries, accelerated tax depreciation on inter-company sales of tower cranes used as rental fleet.
Current Liabilities
Current liabilities decreased by RMB139.3 million to RMB911.1 million as at 31 March 2026 from RMB1,050.4 million as at 31 March 2025. The decrease is mainly due to lower current trade and other payables of RMB100.8 million, lower current borrowings of RMB41.1 million, and lower current tax payables, partially offset by an increase in amounts owing to related parties.
Total Equity
As at 31 March 2026, the Group's total equity amounted to RMB989.7 million, representing a decrease of RMB31.2 million from RMB1,020.9 million as at 31 March 2025. The decrease is mainly due to the total comprehensive loss for the financial year and dividends distributed to equity holders during the period under review.
Review of Cash Flow Statement
2H FY2026 vs 2H FY2025
The Group reported a net increase in cash and cash equivalents amounting to RMB17.3 million in 2H FY2026 mainly due to:
- Net cash used in operating activities of RMB7.1 million, resulting from an increase in operating inventories and decrease in operating payables, and interest and taxes paid, offset by operating profit before working capital changes and decrease in operating receivables.
- Net cash used in investing activities of RMB9.0 million from acquisition of property, plant and equipment, partly offset by interest received; and
- Net cash generated from financing activities of RMB33.4 million mainly from net proceed of bank borrowings and principal portion of lease liabilities, partly offset by lower restricted bank balances.
Full Year FY2026 ("FY2026") vs Full Year FY2025 ("FY2025")
The Group reported a net increase in cash and cash equivalents amounting to RMB23.4 million in FY2026, marking a notable turnaround from the net decrease of RMB10.1 million in FY2025. This was mainly due to:
- Net cash used in operating activities of RMB24.5 million resulted from increase in operating inventories and decrease in operating payables, and interest and taxes paid, offset by operating profit before working capital changes and decrease in operating receivables.
- Net cash used in investing activities of RMB19.1 million from acquisition of property, plant and equipment, partly offset by interest received; and
- Net cash generated from financing activities of RMB67.1 million mainly from net proceed from borrowings, principal portion of hire purchase, advances from a related party and lower restricted bank balances, partly offset by dividend paid.
Commentary
In 2026, the inaugural year of the 15th Five-Year Plan, China's economy is undergoing a deliberate structural transformation toward "new quality productive forces (新质生产力)," prioritising high-tech manufacturing and specialised infrastructure over traditional growth drivers. While the IMF has maintained its growth outlook for the year at 4.5%, noting the resilience of the manufacturing sector, mainstream reports from Bloomberg and Reuters highlight that domestic recovery remains uneven due to protracted real estate consolidation and global trade volatility.
The tower crane industry remains highly competitive. While traditional demand from the private residential sector continues to contract, these market conditions have prompted a strategic realignment toward higher-capacity lifting equipment. Government-led infrastructure, urban renewal, and large-scale renewable energy projects continue to drive demand for mega-sized tower cranes and luffing jib models. Simultaneously, domestic manufacturers are aggressively expanding their footprint in high-growth overseas markets, particularly the Middle East.
Following a period of persistent headwinds and subdued transaction volumes, the Hong Kong property market is showing signs of a turnaround. The private residential market has showed some stabilisation and an increase in transaction volumes. This recovery, supported by talent inflow schemes, mainland buyers, and a lower interest rate environment, is further underpinned by the Government's ongoing public housing targets and transport infrastructure projects.
The Group expects the operating environment to be challenging. The Group remains vigilant and committed to exercising cost discipline and will take necessary remedial actions, where possible.
As announced by the Company on 8 September 2023, 13 March 2024, 22 March 2024, 3 April 2024, 2 May 2024, 1 August 2024, 20 November 2024, 1 April 2025, 28 April 2025, 24 September 2025, 11 July 2025, 5 December 2025, 21 January 2026 and 19 March 2026, there have been no material developments concerning the tower crane accident in Hong Kong involving the Company's 60%-owned subsidiary, Yongmao Machinery (H.K.) Company Limited ("YMHK"), YMHK's wholly-owned subsidiary, Eastime Engineering Limited ("EEL"), and EEL's project manager. This includes the cases related to the Relevant Summonses issued by the Labour Department ("LD Summonses") and the Building Department ("BD Summonses"). The Company will provide further updates if there are any material developments. The cases has been further adjourned to 23 October 2026.